Loading
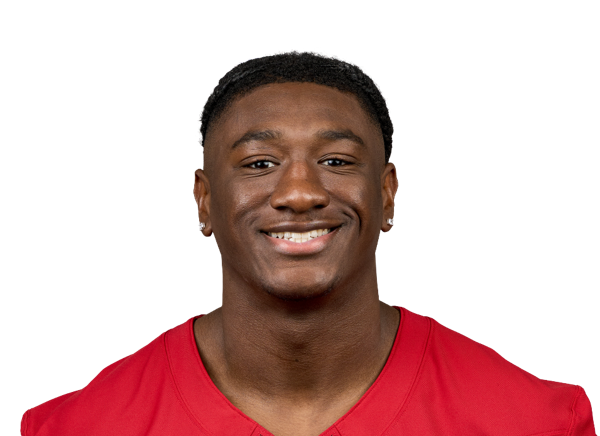

Rivaldo Fairweather
Next: Arizona Cardinals @ Seattle Seahawks Sun, Nov 8, 4:25 PM ET
Games–this season · 0 last season
Passing yards per game–– over the last 5
Rushing yards per game–– over the last 5
Receiving yards per game–– over the last 5
Props
Each of this player's bets replayed over their recent games, strongest first. Red means it has won less often than its price needs.
No props posted for this player right now. Books post most props a day or two before the game.
Per game
Averages over recent windows. A window reaches back into last season when this season has fewer games.
| Window | Games | Snap % | Cmp | Att | Pass yds | Pass TD | INT | Car | Rush yds | Rush TD | Tgt | Rec | Rec yds | Rec TD | FG | XP | Kick pts | Sacks | Tkl |
|---|
Snap %: share of the offense's snaps, % · Cmp: completions · Att: pass attempts · Pass yds: passing yards · Pass TD: passing touchdowns · INT: interceptions thrown · Car: carries (rushing attempts) · Rush yds: rushing yards · Rush TD: rushing touchdowns · Tgt: targets (passes thrown his way) · Rec: receptions · Rec yds: receiving yards · Rec TD: receiving touchdowns · FG: field goals made · XP: extra points made · Kick pts: kicking points · Tkl: tackles + assists (solo plus assisted)
Game log
This season and last, newest first.


