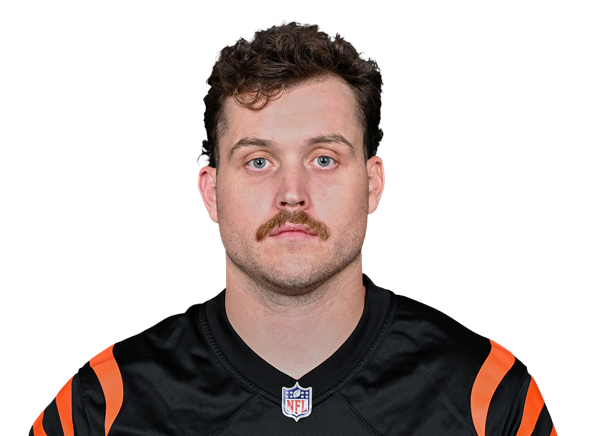
Each of this player's bets replayed over their recent games, strongest first. Red means it has won less often than its price needs.
| Bet | How often it won | Last 10 games | Trend score |
|---|---|---|---|
| 0 of 5· last 5 games0%needs 9% to break even |
Averages over recent windows. A window reaches back into last season when this season has fewer games.
| Window | Games | Snap % |
|---|---|---|
| Last 5 | 5 | 9.2 |
| Last 10 | 5 | 9.2 |
| Last season | 5 | 9.2 |
Snap %: share of the offense's snaps, %
This season and last, newest first.
What ATL's defense has given up to tight ends, against the rest of the league.
| Stat | ATL allows a game | Rank | Average defense |
|---|---|---|---|
| Receiving yardsto tight ends | 54.9 | 15th mostof 32 | 55.3 |
| Receptionsto tight ends | 5.9 | 11th mostof 32, an easy matchup | 5.5 |
| Anytime TDto tight ends | 0.5 | 15th mostof 32 | 0.5 |
Per game over 8 games, this season. “Most” means this defense gives up more than most.
| George Kittle |
| 88 |
| 102 |
| Wk 6 | Colston Loveland | 65 | 68 |
| Wk 5 | Mark Andrews | 28 | 54 |
| Wk 4 | Juwan Johnson | 59 | 59 |
| Wk 3 | Tucker Kraft | 26 | 42 |
| Wk 2 | Darren Waller | 33 | 50 |
| Wk 1 | Pat Freiermuth | 46 | 64 |
| Wk 18last season | Juwan Johnson | 61 | 93 |
| Wk 17last season | Terrance Ferguson | 54 | 107 |
| Average of these 10 | 46 | 63.9 |
Per-game averages in different kinds of games, this season and last, with the row that matches the next game (vs ATL) marked. Few games in a row means it can swing a lot.
| Which games | Played | Snap % |
|---|---|---|
| Every game | 5 | 9.2 |
| Home | 2 | 4.5 |
| AwayNext game | 3 | 12.3 |
| Too few games |
See the bets behind these records with Pro.
The side, the number, the best price, every game behind it and the same bet at other numbers. $4.99 a month, cancel any time.